The Twitter streaming API now lets you recieve all geotagged tweets, not just geotagged tweets in specified areas. This means that with a command like:
curl -d "locations=-180,-90,180,90" http://stream.twitter.com/1/statuses/filter.json -uuser:pass
You can recieve all the geotagged tweets twitter has. I updated my crawler to run against this complete dataset, fixed a few lingering bugs, and then let my crawler run for a few hours:
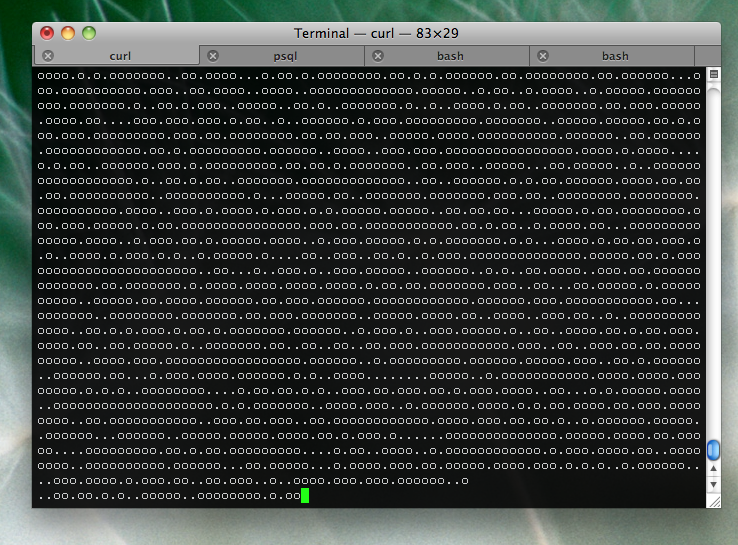 o’s indicate exact location, .’s indicate neighbourhood
I then exported my tweets, and plotted x vs y in R:
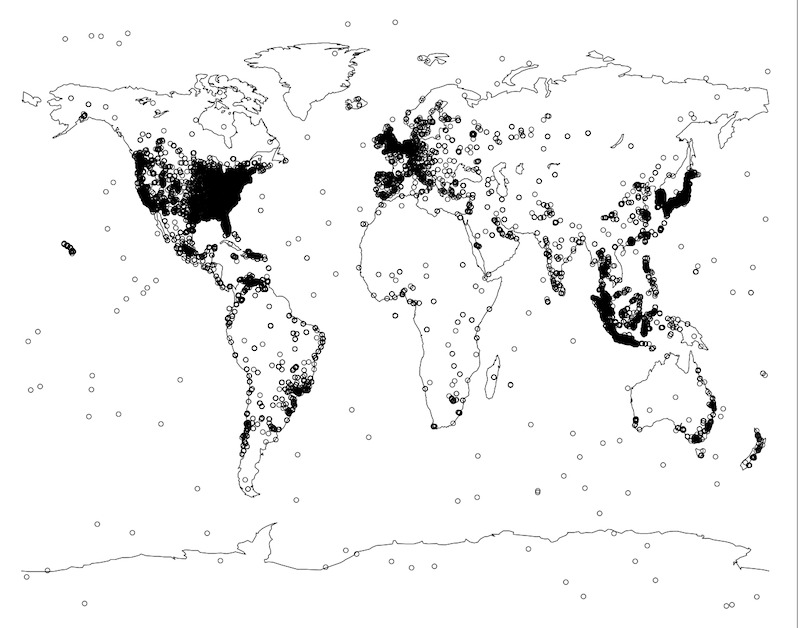 plot(tweets$x, tweets$y); world(add=TRUE)
You can clearly see a world map forming, with a great concentration of geotagged tweets in north america, europe, japan and indonesia, as well as the outlines of Australia and New Zealand.
What if we cluster the points using kmeans?
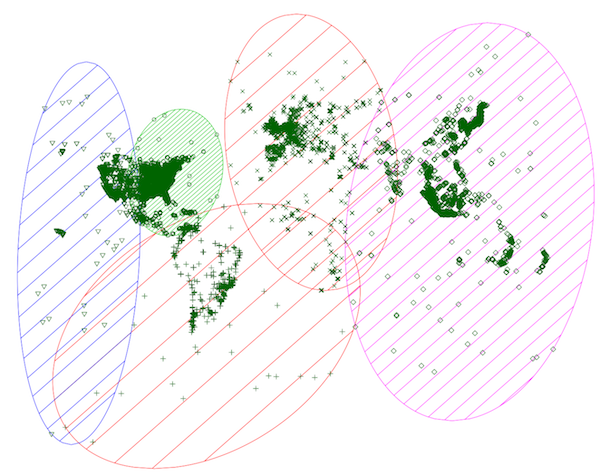 Clustered into 5 groups using kmeans squared
We get 5 clusters, western us, eastern us, europe, asia and south america. Looks like Texas is an eastern state then. It’s kind of scary that Africa is so sparse that it gets gobbled up by Europe, South America and Asia.
I’m keen to see what a histogram of seconds from midnight (what I call epoch) and longitude will look like - but i’ll have to wait til I have 24 hours of data. It looks like I’ll end up with about 2 million tweets per 24 hour period, which should make a good dataset.

 atom feed
 github
 twitter